Note
Work in progress.
Introduction
The Data Quality Assessment Plan (LSE-63) defines four levels of QA summarized here:
- Level 0 QA: test the DM software during pre-commissioning as well as test software improvements during commissioning and operations, quantifying the software performance against known expected outputs.
- Level 1 QA: data quality in real time during commissioning and operations. Analyzes the data stream in real time, information about observing conditions (sky brightness, transparency, seeing, magnitude limit) as well as characterize subtle deterioration in system performance.
- Level 2 QA: assesses the quality of data releases (including the co-added image data products) performing quality assessment for astrometric and photometric calibration and derived products, looking for problems with the image processing pipelines and systematic problems with the instrument.
- Level 3 QA: data quality based on science analysis performed by the LSST Science Collaborations and the community. Level 0-2 visualization and data exploration tools will be made available to the community.
During pre-commissioning, the LSST DM Software and its data products are being evaluated by processing precursor datasets from surveys like DECam, CFHT and HSC. These verification datasets were selected to span a wide range of regimes and to test Level 1 (Alert Production) and Level 2 (Data Release Production) data products.
SQuaRE is concerned about preserving the knowledge developed in this effort and reuse as much as possible the code in the production Data Quality Assessment Framework (DQAF), possibly at all levels of QA.
In practice, that can be achieved by developing a prototype of the DQAF that would be adopted, maintained and refined by the verification scientists. At the same time, they have similar needs in terms of data access, data processing and visualization and would benefit from a common infrastructure that facilitates all those aspects.
The verification datasets use case has specific needs that must be distinguished from the production system. Since we are processing multiple datasets, it makes sense to accumulate QA information across multiple runs and compare the results later. That motivates an unified database model capable of storing QA results for different cameras. However,in production, each run will result in a different database with associated QA tables (http://ldm-135.readthedocs.org/). Despite those differences, the end goal of a prototype at this point is to leverage the design of the production QA database.
Single Image Requirements
LPM-17 is the basis for the present design, it specifies single image requirements and how to select the samples to compute them. In this section we summarize the single image requirements and discuss the sample selection based on the outputs available in the baseline database schema (https://lsst-web.ncsa.illinois.edu/schema/index.php?t=RefObjMatch&sVer=baseline) as specified by LSE-163.
The samples for computing Image Depth, Image Quality, Astrometry and Photometry accuracy requirements should be create as views in the production database for convenience.
TODO: include tables summarizing the single image requirements in LPM-17
TODO: write queries to select datasets for image depth, image quality, astrometry and photometry accuracy based on LPM-17 from the baseline database schema and double check with LSE-163
TODO: if we don’t have the ingestion code ready for the prototype development (https://jira.lsstcorp.org/browse/DM-4811) how we are going to proceed?
Image depth
Sample selection: r band images in good seeing < 0.7 arcsec (FWHM) on photometric dark nights (r-band sky brightness > 21 \(mag/arcsec^2\)) close to the zenith (airmass < 1.2) and total exposure time of 30s.
SELECT visitId,
       ccdVisitId,
       psFlux,
       psFluxSigma
FROM Source s
INNER JOIN CcdVisit c ON s.ccdVisitId=c.ccdVisitId
INNER JOIN Visit v ON c.visitId=v.visitId
WHERE v.filterName='r'
AND c.seeing < 0.7
AND s.skySigma > 21
AND v.airmass < 1.2
AND v.expTime*v.nExposures = 30
AND s.flags=0;
- Notes
Table 5 (Catalog
Sourcetable) in LSE-163 does not havepsFluxSigma, Table 6 (CatalogForcedSourcetable) haspsFluxErr, Table 2 (DIAObject table) has both.Section 5.3 of LSE-163 has a note about denormalizing the tables for user convenience, but it seems unnecessary to repeat
filterNamefor all the sources in theSourcestable and for all Ccds in theCcdVisittable.filterNamecan be obtained by joiningSourceandVisitand it seems that these joins are necessary to get other metadata anyway.In LPM-17, requirements are specified in AB magnitudes while in LSE-163 and in the baseline database schema the columns (
psFlux,psFluxSigmaandskySigma) are fluxes in units of “maggie”. A view in the database with those columns in magnitudes would facilitate the comparison with the science requirements. A function in the database to convert from maggie to AB magnitudes would also be useful, it seems that the current Science Tools for MySQL has only AB fluxes to AB magnitude conversion (https://lsst-web.ncsa.illinois.edu/schema/sciSQL_0.3/#photometry-scisql_fluxToAbMag)The query currently looks for the sky background at the position of the source instead of looking at an average sky background at the visit level, should we add this summary information to the visit table?
Why
skyBgis stored as counts in theCcdVisittable andskyis stored in \(mag/arcsec^2\) in theSourcestable?The
totalExpTime=expTime*nExposureslooks like an useful quantity to store in the visits table.The Image Depth requirements mention point sources but we don’t have an
extendednessparameter in theSourcestable. Do we need to do co-addition first and then forced photometry to have this parameter associated to a source?The way photometric flags are implemented in the current database baseline schema is not defined, assumming a bitmask will be used, the condition
flags=0ensures bad sources are rejected.
The overall image depth distribution
Specification: The distribution of the 5 \(\sigma\) (SNR=5) detection depth for point sources for all the exposures in the r band will have a median not brighter than D1 mag, and no more than DF1 % of images will have 5 \(\sigma\) depth brighter than Z1 mag. D1 and Z1 are expressed in the AB system.
- Notes
- Does exposure means visit here? in the sample selection we have
totalExpTime = 30s. What does image mean? visit too?
| Quantity | Design Spec | Minimum Spec | Stretch Goal |
|---|---|---|---|
| D1 (mag) | 24.7 | 24.3 | 24.8 |
| DF1 (%) | 10 | 20 | 5 |
| Z1 (mag) | 24.4 | 24 | 24.6 |
DF1 is the fraction not of all exposures but of those in the selected sample.
The variation of the image depth (throughput) with bandpass
Specification: The median 5 \(\sigma\) (SNR=5) detection depth for point sources in a given band will not be brighter than DB1 mag.
| Quantity | Design Spec | Minimum Spec | Stretch Goal |
|---|---|---|---|
| u DB1 (mag) | 23.9 | 23.4 | 24 |
| g DB1 (mag) | 25.0 | 24.6 | 25.1 |
| r DB1 (mag) | 24.7 | 24.3 | 24.8 |
| i DB1 (mag) | 24.0 | 23.6 | 24.1 |
| z DB1 (mag) | 23.3 | 22.9 | 23.4 |
| y DB1 (mag) | 22.1 | 21.7 | 22.2 |
The variation of the image depth over the field of view
Specification: For an image representative of the median depth (i.e with the 5 \(\sigma\) detection depth of D1 mag), the depth distribution over individual devices will have no more than DF2 % of the sample brighter by more than Z2 mag than the median depth.
| Quantity | Design Spec | Minimum Spec | Stretch Goal |
|---|---|---|---|
| DF2 (%) | 15 | 20 | 10 |
| Z2 (mag) | 0.2 | 0.4 | 0.2 |
Image Quality
- Notes
- There is no extendedness parameter in the
Sourcetable, how should we select stars for Image Quality requirements?
The delivered image size distribution
Astrometry Accurracy
Photometry Accurracy
The QA database
The database is being designed according to some general guidelines:
- Should store the results of the science requirements and summary information for CCDs and Visits;
- Should be easily extended, i.e additional tests should be included without changing the schema;
- Should be optimized for interactive visualization, i.e the results of the science requirements and summary information
are pre-computed and stored in ‘materialized views’ for performance improvements; - Must be camera agnostic, i.e support DECam, CFHT and HSC images processed by the stack;
The main difference between the verification datasets use case and the production system is that here the QA results from multiple runs will be accumulated in a single database, including basic provenance information. Thus, in addition to the science requirements and summary information table we also have process information tables.
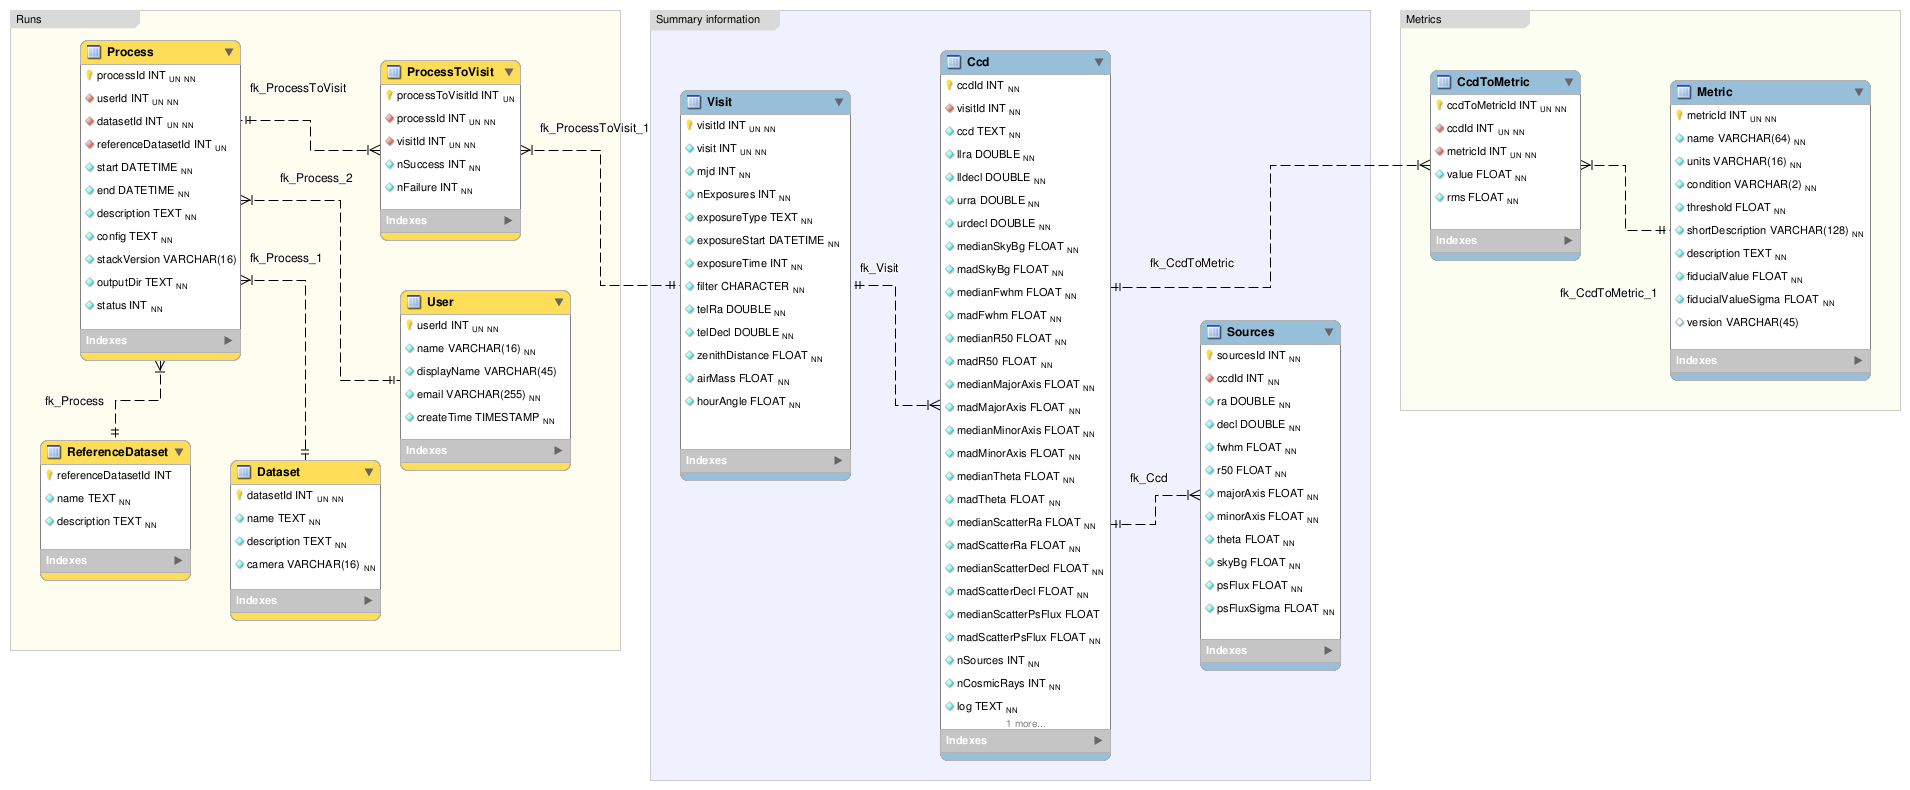
Figure 1 QA database model.
The source code is maintained in this repo https://github.com/lsst-sqre/qa-database
The proposed database has three sets of tables:
- Science Requirements
- Are based on the single image specification contained in the Science Requirements Document (LPM-17) and associated to each single ccd. Science Requirement descriptions, results, conditions and thresholds are stored in the metrics table.
- Summary Information
- They store medians and MADs (Median Absolute Deviations) of interesting properties of each CCD, it enables fast visualization and aggregate quantities computed at the visit level. These properties are computed from a subset of high S/N point sources also stored in the database.
- Process information
- They store basic provenance information such as configuration, data repository path, code version and logs of each process. If the full image and source catalogs are required for futher inspection they can be retrieved from the data repository using the butler.
It is also being designed to be a common model for the different instruments supported by the stack. An advantage of that is the comparison of metrics and results accross different processes of the same dataset or accross different datasets. The mechanism for translating camera-specific metadata to this common model is still under discussion.
Sample queries
Process information
- Give me all processed datasets, run numbers, date, duration, status and who processed
SELECT d.name,
    p.processId,
    p.start,
    p.end - p.start as duration,
    p.status,
    u.username
FROM Process p
INNER JOIN Dataset d ON p.datasetId = d.datasetId
INNER JOIN user u ON p.userId = u.userId;
- For run=xxxx, give me the fraction of ccd failures
SELECT ptv.nFailure/(ptv.nSuccess + ptv.nFailure) as fraction
FROM ProcessToVisit ptv
INNER JOIN Process p ON ptv.processId=p.processId
WHERE processId = 'xxxx';
- For run=xxxx, give me a list of visits with failures
SELECT visit
FROM Visit v
INNER JOIN ProcessToVisit ptv ON v.visitId = ptv.visitId
INNER JOIN Process p ON ptv.runId = p.runId
WHERE ptv.nFailure > 0 AND p.processId = 'xxxx';
- Give me the footprint of run xxxx (i.e. corners in sky coordinates of all processed ccds)
SELECT c.llra,
   c.lldec,
   c.urra,
   c.urdec
FROM Ccd c
INNER JOIN Visit v ON c.visitId = v.visitId
INNER JOIN ProcessToVisit ptv ON v.visitId = ptv.visitId
INNER JOIN Process p ON ptv.processId = p.processId
WHERE p.processId = 'xxxx';
- Give me the configuration and version of the stack used to process visit yyyy in run xxxx
TODO: include stackVersion in Process table
SELECT p.config,
    p.stackVersion
FROM Visit v,
INNER JOIN ProcessToVisit ptv ON v.visitId = ptv.visitId
INNER JOIN Process p ON ptv.processId = p.processId
WHERE v.visit = 'yyyy'
AND p.processId = 'xxxx';
Summary Information
- Give me filter, exposure time, zenith distance, air mass, hour angle, fwhm, ellipticity, sky background and the scatter in ra and decl of all ccds in visit yyyy
SELECT v.filter,
    v.exposureTime,
    v.zenithDistance,
    v.airMass,
    v.hourAngle,
    c.medianFwhm,
    1.0-c.medianMinorAxis/c.medianMajorAxis as ellipticity,
    c.medianSkyBg,
    c.medianScatterRa,
    c.medianScatterDecl
FROM Visit v,
    Ccd c
WHERE v.visitId = c.visitId
AND v.visit = 'yyyy';
- Give me summary information for all visits processed by run xxxx (use
scisql_median()to aggregate values per visit)
SELECT v.visit,
   v.filter,
   v.exposureTime,
   v.zenithDistance,
   v.airMass,
   v.hourAngle,
   scisql_median(c.medianFwhm) as fwhm,
   scisql_median(1.0-c.medianMinorAxis/c.medianMajorAxis) as ellipticity,
   scisql_median(c.medianSkyBg) as skyBg,
   scisql_median(c.medianScatterRa) as scatterRa,
   scisql_median(c.medianScatterDecl) as scatterDecl
FROM Ccd c
INNER JOIN Visit v ON c.visitId = v.visitId
INNER JOIN ProcessToVisit ptv ON v.visitId = ptv.visitId
INNER JOIN Process p ON ptv.processId = p.processId where ProcessId = 'xxxx'
GROUP BY v.visit,
     v.filter,
     v.exposureTime,
     v.zenithDistanced,
     v.airMass,
     v.hourAngle
ORDER BY v.visit;
- Give me the process ccd logs of failed ccds in visit yyyy
SELECT c.log
FROM Visit v,
    Ccd c
WHERE v.visitId = c.visitId
AND v.visit = 'yyyy'
AND c.status = 1;
Give me the source catalog and image FITS files for ccd c, visit yyyy procesed by run xxxx
Can’t be done in SQL, but an API can return the
outputDirand then one can use the butler to get files giving the ccd and visit.Give me median scatter in RA and Dec for all visits in all runs that processed dataset=zzz, the version of the stack, the configuration file used, from date=yyyy-mm-dd
SELECT p.processId as run,
    v.visit,
    scisql_median(c.medianScatterRa) as ra_scatter,
    scisql_median(c.medianScatterDecl) as dec_scatter,
    p.stackVersion,
    p.config
FROM Ccd c
    INNER JOIN Visit ON c.visitId = v.visitId
    INNER JOIN ProcessToVisit ptv ON v.visitId = ptv.visitId
    INNER JOIN Process p ON ptv.processId = p.processId
    INNER JOIN dataset d ON p.datasetId = d.datasetId
WHERE d.name = 'zzzz'
AND p.start > 'yyy-mm-dd'
GROUP BY v.visit
ORDER BY p.processId;
- Recover DECam image quality history (e.g. fwhm and its scatter) from date yyyy-mm-dd to yyyy-mm-dd looking at all runs that processed decam dataset
SELECT p.processId as run,
   d.name as dataset,
   v.visit,
   scisql_median(c.medianFwhm) as fwhm,
   scisql_median(c.madFwhm) as scatter
FROM Ccd c
INNER JOIN Visit ON c.visit_id = v.visit_id
INNER JOIN ProcessToVisit ptv ON v.visitId = rv.visitId
INNER JOIN Process p ON ptv.processId = p.processId
INNER JOIN Dataset d ON p.datasetId = d.datasetId
WHERE d.camera = 'decam'
AND p.start > 'yyyy-mm-dd'
AND p.end < 'yyyy-mm-dd'
GROUP BY v.visit
ORDER BY p.processId;
QA Metrics
- Give me all metrics descriptions, conditions and thresholds available
- Give me all metrics where at least one ccd failed in run xxx
- Give me the fraction of visits in run xxxx that passed metric mmmm
- Give me the value and sigma of the metric mmmm for all ccds in visit yyyy
References
- LSE-63 Data Quality Assurrance Plan
- LPM-17 Science Requirements Document
- LDM-135: Database Design
- LSST Database Schema, baseline version (https://lsst-web.ncsa.illinois.edu/schema/index.php?sVer=baseline)
- pipeQA
- HSC Database schema v1.0
- DES Quick Reduce and DES operations database